
Overview
The Hep C Elimination tool uses the Hepatitis C Disease Burden Simulation model (HEP-SIM). HEP-SIM is an individual-level dynamic model that simulates the epidemic, disease progression, and elimination strategies of hepatitis C infection in a given country or regional setting. It simulates the clinical management of hepatitis C virus (HCV) infection by incorporating HCV natural history, transmission, diagnosis rate, and treatment access to direct-acting antiviral (DAA) therapies from 2015 to 2040. By having a common structure for input parameters, the HEP-SIM model allows for analysis to be easily customized for different countries. The version of HEP-SIM used in the Hep C Elimination tool extends a previously developed1-4 HEP-SIM model by incorporating HCV transmission. With country/region-specific data, we use HEP-SIM to:
- project the disease and economic burden under different HCV screening and treatment rates that can lead to HCV elimination,
- assess whether the WHO elimination targets (or other user-defined targets) will be achieved at the end of 2030 (or another user-defined target year), and
- forecast the total cost associated with the elimination efforts.
Patient Demographics and Epidemic Baseline
In the HEP-SIM model, the simulated population is defined by demographic characteristics (age and sex) and clinical characteristics (HCV infection and liver disease state, HCV genotype, infection awareness, treatment history) for each region. Each individual is defined by one of the four compartments: (1) susceptible, representing the healthy population who have never been infected; (2) infected but undiagnosed, (3) infected and diagnosed, and (4) cured (i.e., SVR achieved after treatment).
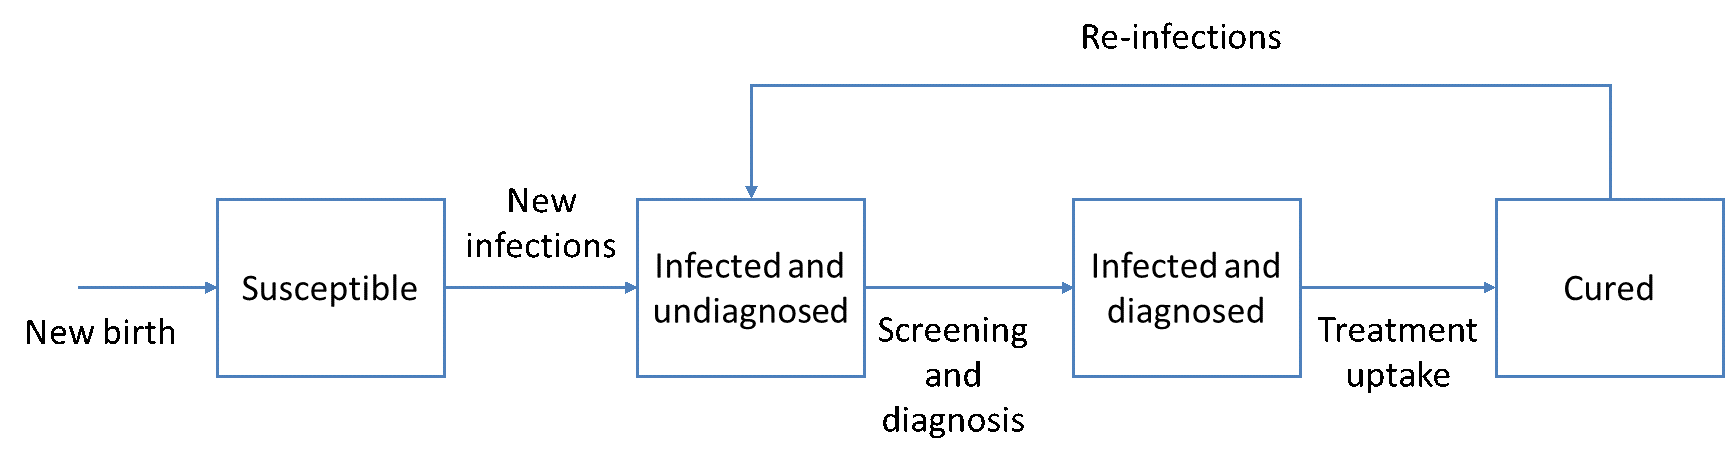
Figure 1. Compartments showing dynamic transitions in the HEP-SIM model
The initial states of individuals are sampled based on country-specific estimates at year 2015 (or close to year 2015). These estimates are:
- Age distribution of overall population
- Chronic HCV prevalence by age categories
- Awareness rate among infected individuals
- Distribution of fibrosis and cirrhosis states among infected patients
- Distribution of HCV genotype
- Probability of male gender
- Probability of high-risk population
The population is further stratified into two categories: (1) low-risk population (i.e., general population), and (2) high-risk (e.g., people who inject drugs [PWID]). We assumed that the two populations to be “parallel” without transitions between each other.
New infections of HCV
In each year, new individuals are added to the existing susceptible population according to the birth rates in the given country. Each susceptible individual can get infected with HCV given a probability, called the infection force  , which is proportional to the disease prevalence:

where  represents the infection rate,
  and
and  represent the number of infected patients without and with diagnosis, respectively, and
  represents the prevalence. The total number of new infections is defined by
  . In the model, the value of infection rate could be further stratified by age categories if needed.
Furthermore, we considered reinfections from those who have been cured. We assumed a lower infection rate in this case as the cured patients may be more cautious and have less risky behaviors that could cause disease transmission. The number of reinfection during a year is
 , where
  represents the relative susceptibility of cured patients.
Natural History of HCV
The natural history of HCV in HEP-SIM model was defined using acute and chronic phase of HCV where chronic HCV was defined using METAVIR fibrosis scores (F0–F4), decompensated cirrhosis, hepatocellular carcinoma, liver transplantation, and liver-related death.
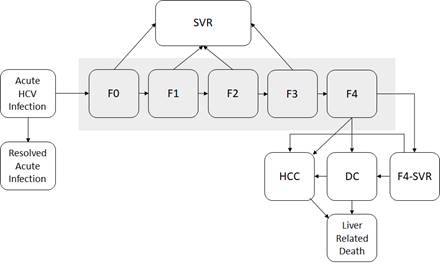
Figure 2. State-transition model of the natural history of HCV
At any given time, a patient is represented by one of the health states, which are shown by squares. Arrows between states represent possible transitions based on annual probabilities. Patients whose disease is successfully treated transition to the sustained virologic response (SVR) state. Patients who achieve SVR from F0 to F3 states are assumed to be cured; however, patients in an F4 state who are successfully treated transition to an F4-SVR state and may still progress to decompensated cirrhosis and further complications. Moreover, the HCC risks from F3 and CC states are not eradicated after patients achieve SVR. Post-SVR HCC incidences for these patients were estimated from a recent large cohort study on the risks of HCC in patients cured with DAA.5 Patients in HCC and DC states have a higher mortality rate than the general population. All other patients have the same risk for death as the general population. We used a published meta-analysis to estimate fibrosis progression from F0 to F4 (Table 1).6 We estimated disease progression in HCV sequelae from published observational studies.7-9 The probability of death from other causes exists in every state, but deaths from other causes are not shown. Because very few liver transplantations occur in many developing countries that are considering the Hep C Elimination Tool, we did not consider liver transplantation in our model.
Table 1. Annual transition probabilities for different states used in HEP-SIM model
Input |
Base case |
|
|
F0 to F1 6 |
0.117 |
|
|
F1 to F2 6 |
0.085 |
|
|
F2 to F3 6 |
0.120 |
|
|
F3 to F4 6 |
0.116 |
|
|
F4 to DC 7 |
0.039 |
|
|
F4 to HCC 7 |
0.014 |
|
|
F3 to HCC |
0.008 |
|
|
F3-SVR to HCC |
0.0019 |
|
|
F4-SVR to DC 10 |
0.008 |
|
|
F4-SVR to HCC 10 |
0.005 |
|
|
DC to HCC 8 |
0.068 |
|
|
DC (first year) to death from liver disease 8 |
0.182 |
|
|
DC (subsequent year) to death from liver disease 8 |
0.112 |
|
|
HCC to death from liver disease 7 |
0.427 |
|
|
Death from other causes |
Life table |
Abbreviations: SVR, sustained virologic response; F0–F4, METAVIR fibrosis score; DC, decompensated cirrhosis; HCC, hepatocellular carcinoma; F4-SVR, Post-SVR state of treated cirrhotic patient
HCV Screening
Undiagnosed patients could become aware of their HCV status through a screening program. In HEP-SIM model, we implemented a one-time screening program. Individuals who are not in the “infected and diagnosed” compartment and have not been screened before are eligible for one-time screening.
Annual screening rate (% of screening eligible population per year) is a model input. Various annual screening rate from 0 to 20% with an increment of 1% are evaluated. We first calculate the number of screenings in each year (by multiplying the total number of screening-eligible individuals and the screening rate). We then randomly selected the same number of patients for screening. Patients with a positive screening test (i.e., antibody test) are followed up with a diagnostic test (i.e., RNA test) to confirm the infection. Since the test accuracy is fairly high (sensitivity and specificity >98%), we did not explicitly model the test sensitivity and specificity in our model.
HCV treatment
Because all diagnosed patients cannot be treated in a single year, we implemented an annual treatment uptake rate defined by the % of diagnosed patients who can receive DAA treatment each year. Various treatment uptake rates from 0 to 80% with an increment of 5% are evaluated. All diagnosed patients are eligible for treatment, and no prioritization of patients based on fibrosis stages was considered. We assumed an SVR rate of 90% in this model, meaning that 90% of patients who receive DAA treatment will achieve SVR, regardless of their genotype and fibrosis state at treatment.
Costs
To evaluate the cost of HCV elimination, we incorporated the following three cost components from a payer’s perspective:
- Cost of management of HCV-associated health states in 2018 US dollars. We estimated these costs for F0-F4, cirrhosis, and HCC states using the WHO CHOosing Interventions that are Cost Effective (CHOICE) project. We only accounted for health state cost of patients who are aware of their HCV infection and those with advanced sequalae (i.e., DC, HCC).
- Cost of HCV testing, which included the cost of antibody testing for population-wide screening, and the cost of testing viremia (e.g., RNA testing) for diagnosis in those who showed positive antibody testing results from the population screening.
- Cost of antiviral treatment,11 which included the cost of one treatment course with DAA, and cost of testing for assessing treatment response.
References
- Kabiri M, Jazwinski AB, Roberts MS, Schaefer AJ, Chhatwal J. The changing burden of hepatitis C in the United States: Model-based predictions. Annals of Internal Medicine. 2014;161(3):170-180.
- Chhatwal J, Wang X, Ayer T, et al. Hepatitis C disease burden in the United States in the era of oral direct-acting antivirals. Hepatology 2016;64(5):1442-1450.
- Chhatwal J, Chen Q, Aggarwal R. Estimation of Hepatitis C Disease Burden and Budget Impact of Treatment Using Health Economic Modeling. Infectious Disease Clinics. 2018;32(2):461-480.
- Chhatwal J, Chen Q, Wang X, et al. Assessment of the Feasibility and Cost of Hepatitis C Elimination in Pakistan. JAMA Netw Open. 2019;2(5):e193613.
- Kanwal F, Kramer J, Asch SM, Chayanupatkul M, Cao Y, El-Serag HB. Risk of Hepatocellular Cancer in HCV Patients Treated With Direct-Acting Antiviral Agents. Gastroenterology. 2017;153(4):996-1005 e1001.
- Thein H, Yi Q, Dore G, Krahn M. Estimation of stage-specific fibrosis progression rates in chronic hepatitis C virus infection: A meta-analysis and meta-regression. Hepatology. 2008;48(2):418-431.
- Fattovich G, Giustina G, Degos F, et al. Morbidity and mortality in compensated cirrhosis type C: a retrospective follow-up study of 384 patients. Gastroenterology. 1997;112(2):463-472.
- Planas R, Ballesté B, Antonio Álvarez M, et al. Natural history of decompensated hepatitis C virus-related cirrhosis. A study of 200 patients. Journal of Hepatology. 2004;40(5):823-830.
- Wolfe R, Roys E, Merion R. Trends in Organ Donation and Transplantation in the United States, 1999–2008. American Journal of Transplantation. 2010;10(4p2):961-972.
- Cardoso AC, Moucari R, Figueiredo-Mendes C, et al. Impact of peginterferon and ribavirin therapy on hepatocellular carcinoma: incidence and survival in hepatitis C patients with advanced fibrosis. Journal of Hepatology. 2010;52(5):652-657.
- Chhatwal J, Chen Q, Bethea E, et al. Hep C Calculator: an online tool for cost-effectiveness analysis of DAAs. Lancet Gastroenterology and Hepatology. 2018;3(12):819.